Reports & Analytics
CahierPos turns raw sales data into clear, actionable insights — in real time. Track revenue, cashier performance, and inventory across every branch without ever opening a spreadsheet.
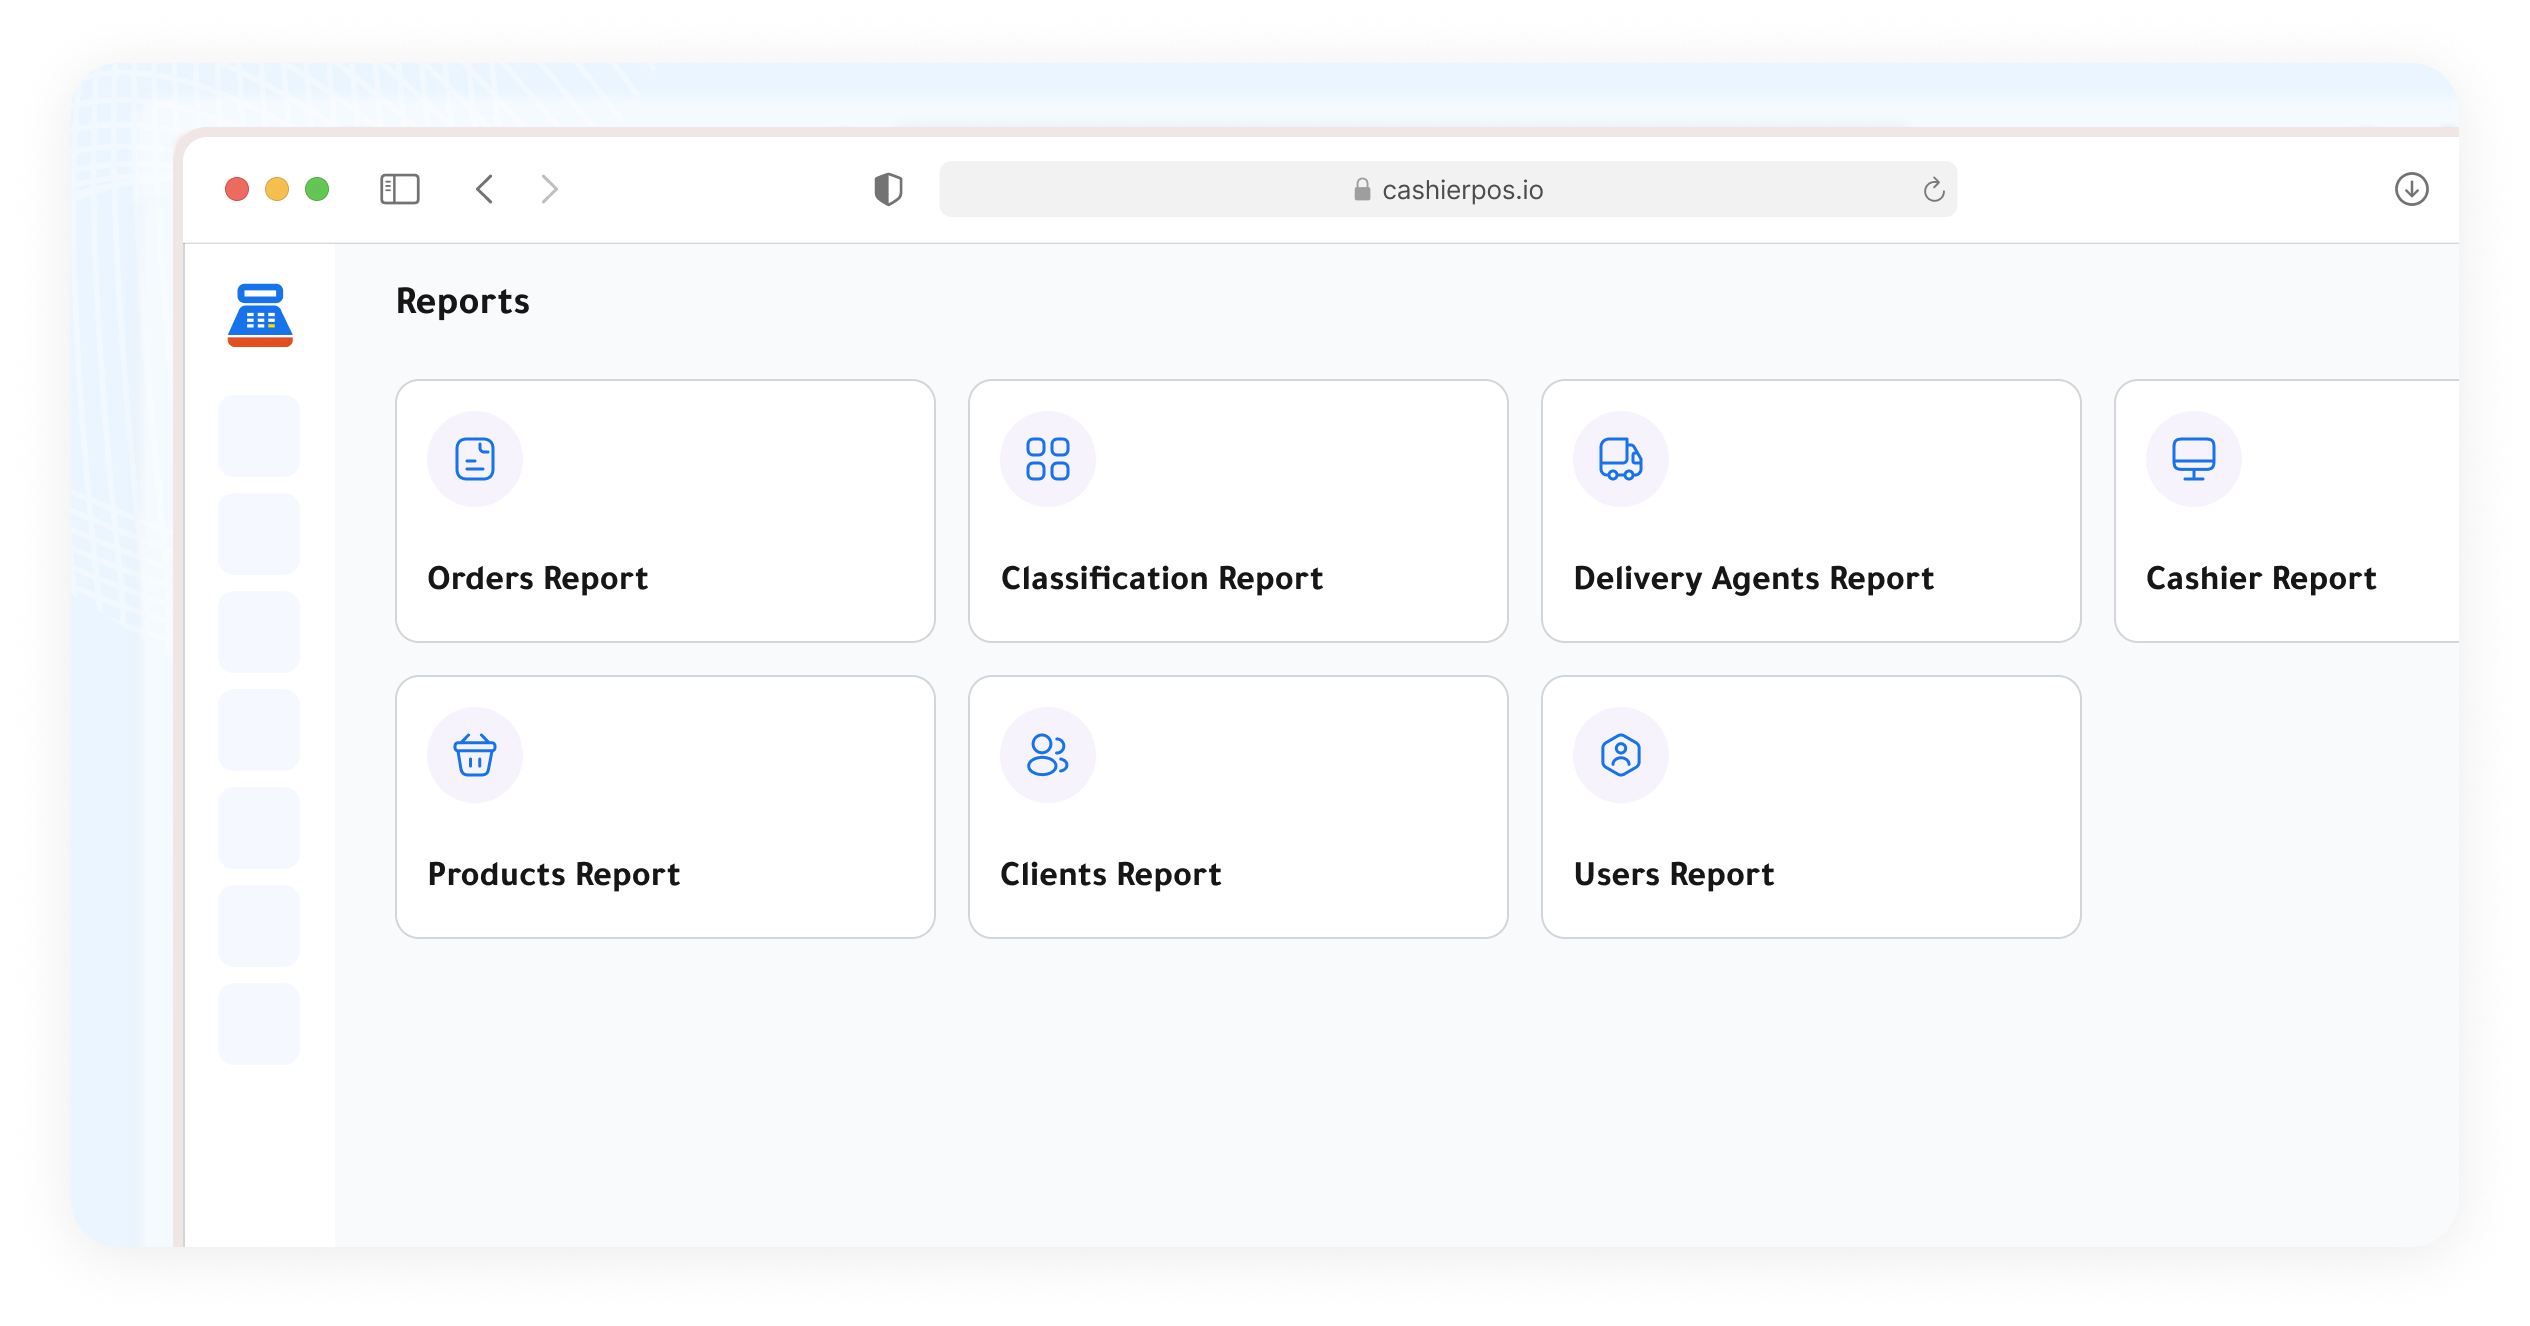
Every insight your business needs, built right in
Six powerful reporting modules — from live dashboards to scheduled exports — designed for operators, not analysts.
Real-Time Sales Dashboard
Watch your revenue, order count, and average ticket update live as transactions happen — across every branch, simultaneously.
Cashier Performance Reports
See exactly how much each cashier sold, how many transactions they processed, and how long their shifts ran — with full audit trails.
Top-Selling Products Analysis
Identify your best and worst performers by revenue, quantity, or margin. Filter by branch, date range, or category.
Inventory Movement Reports
Track stock consumed, transferred, and adjusted per branch. Spot shrinkage early and keep replenishment ahead of demand.
Revenue & Tax Summaries
Generate daily, weekly, and monthly financial summaries with tax breakdowns — ready for your accountant in one click.
Scheduled PDF & Excel Export
Schedule any report to be delivered automatically to your inbox — daily, weekly, or monthly — in PDF or Excel format.
Your data, filtered and ready in seconds
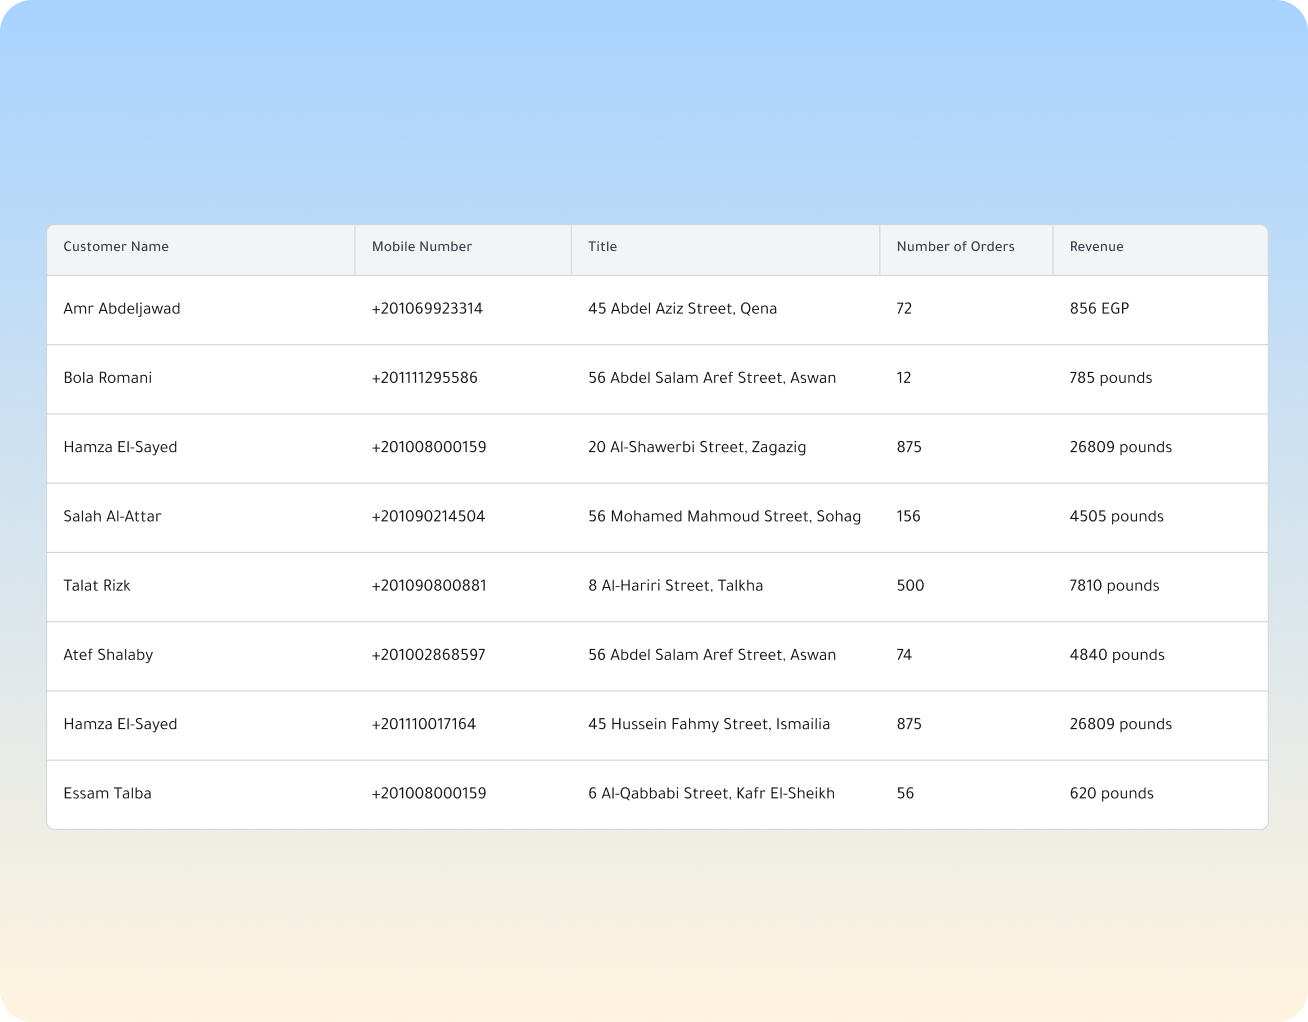
Filter any report by date range, branch, cashier, or product category. Drill down or zoom out — the data shapes itself to your question.
-
 Custom date ranges Compare any two periods side by side to spot trends
 -
Cross-branch comparison Rank branches by any metric to find your best performers
-
One-click export Download any report as PDF or Excel instantly — no configuration